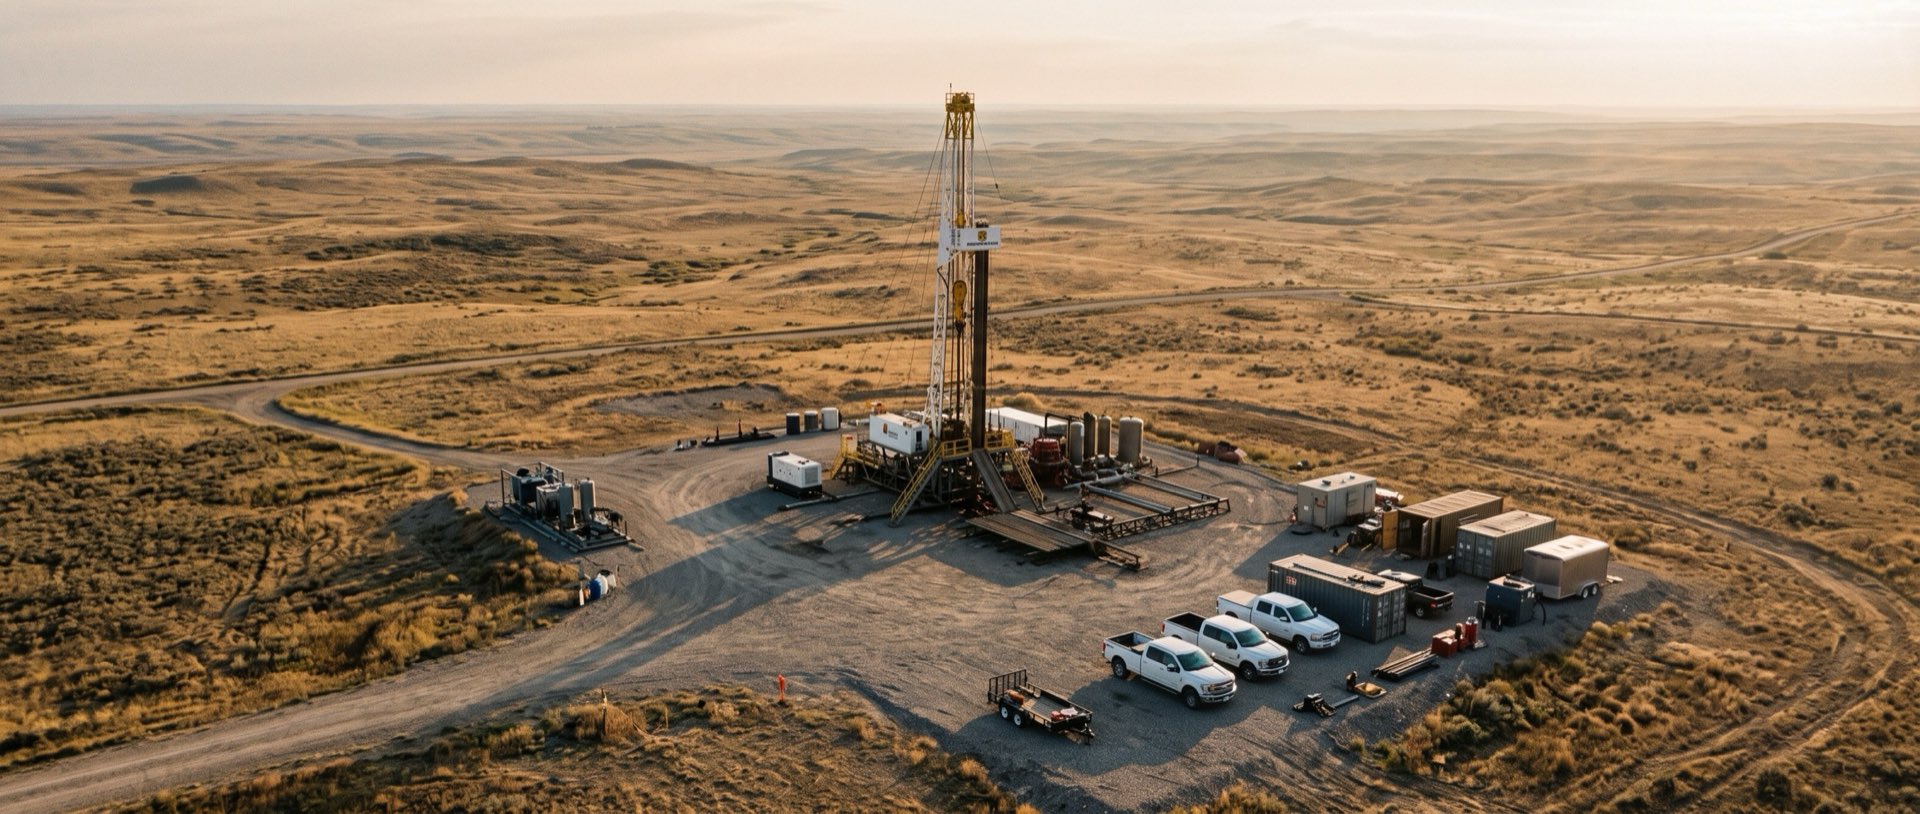
Oil production has fallen
If restricted flow around the well is contributing to the decline, cleaning may help. A depleted reservoir or a failed pump requires a different assessment.
See suitable candidatesChemical-free treatment for existing wells
Oil reaches a well through tiny spaces in the surrounding rock. When those paths become restricted, production can fall. Our downhole tool uses water-driven vibrations to help restore flow in suitable wells.
For oil producers and water-injection wells. Each well is evaluated before a treatment is proposed.
The tool behind the treatment
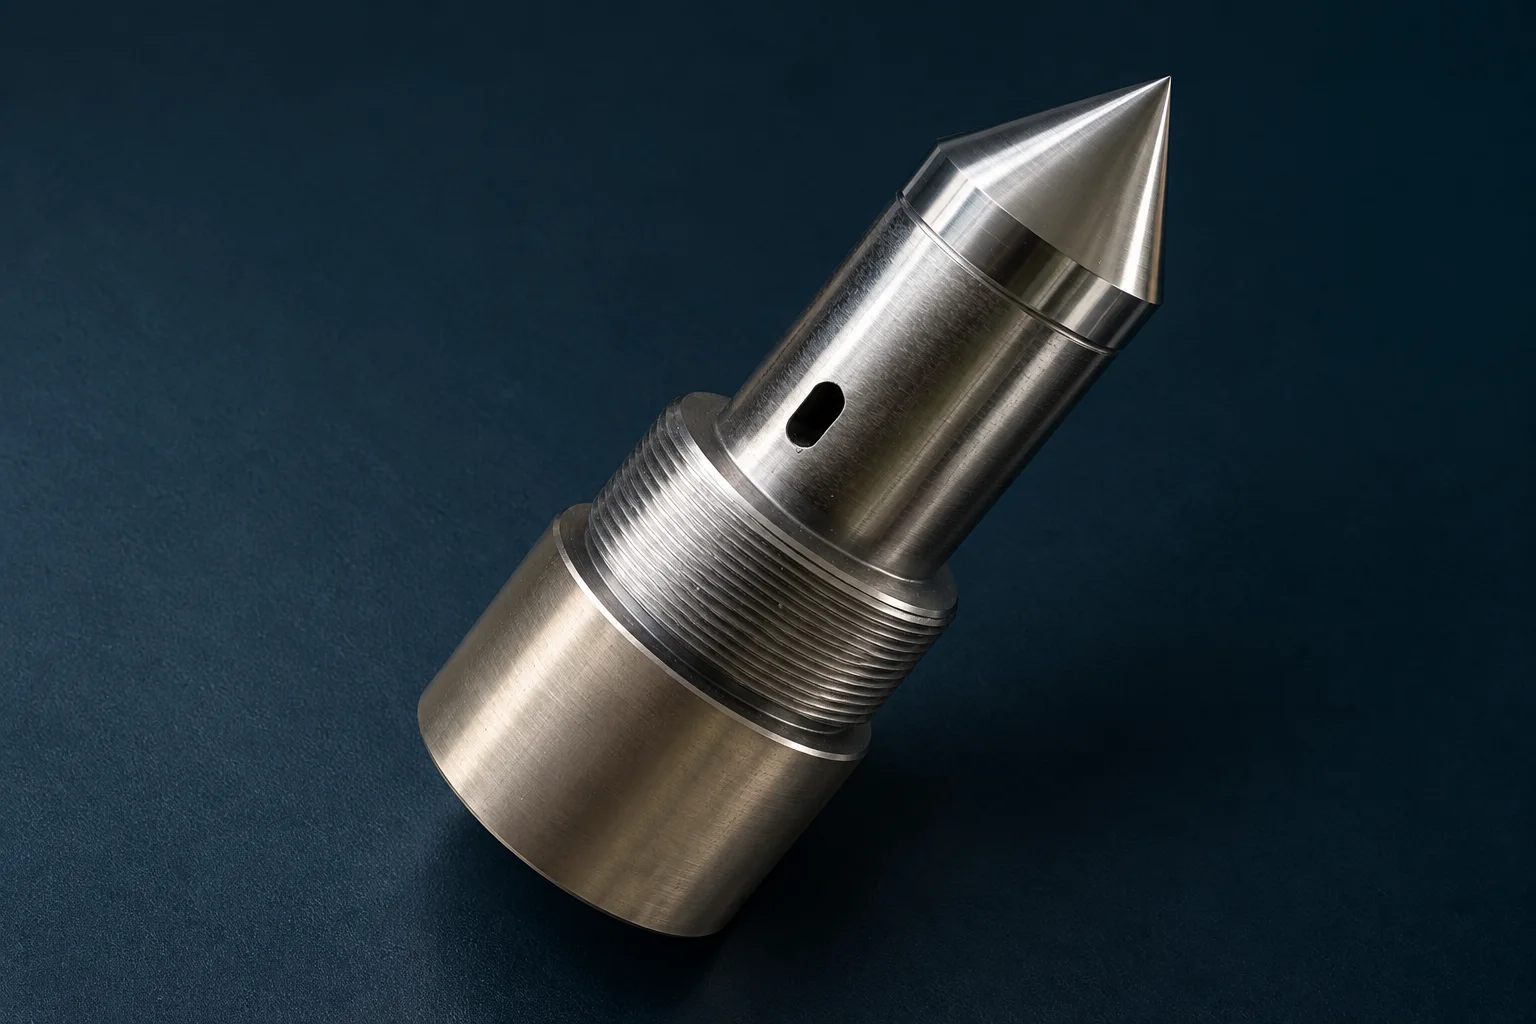
Wave Generator
AI visualization · based on the original photograph
Placed inside the well at the target interval. Circulating water powers its vibrations.
See the tool and equipmentThe treatment, step by step
We focus on the rock just around the producing interval. Engineers call this the bottomhole zone or near-wellbore formation.
Inside the treatment · 40-second walkthrough
Blue: circulating water. Copper: pressure waves and oil-flow paths. Schematic only; not to scale or a simulation of your well.
Oil reaches the well through pores in the surrounding rock. Deposits or trapped fluids can restrict those paths. We first assess whether that is the problem in this well.
The Wave Generator is lowered on tubing to the selected interval. It is designed for that formation; the target is the rock around the well, not a new hole in the ground.
A surface pump circulates water down the tubing and through the tool. Pressure waves help mobilise restrictions. Returning fluid travels up the annulus to a separation tank.
If the restriction responds, flow into the well can improve. We compare oil, water and gas rates or injectivity under comparable conditions. An improvement is an intended outcome, not a guarantee.
Choose a step or play the walkthrough.
What we provide
The Wave Generator is the product. Well evaluation, treatment design and its field application form the service. The work is planned around your completion, your equipment and the restriction being treated.
Explore our serviceStart with production history and completion details. We assess whether restricted flow near the well is a suitable target.
Design the generator for the formation, position it downhole and circulate the working fluid.
Compare oil production or water injectivity before and after treatment under comparable conditions.
If restricted flow around the well is contributing to the decline, cleaning may help. A depleted reservoir or a failed pump requires a different assessment.
See suitable candidatesThe technology record also includes injection wells. The objective is to improve how readily water enters a damaged formation.
Explore injection-well resultsCompare the damage mechanism, full treatment scope, downtime and quotes. Both methods need to fit the well.
Compare methods and dollarsDocumented field experience
The supplied technology record covers approximately 1,000 production and injection wells, with a reported 65–70% success rate. These examples show actual reported responses, not a forecast for your well.
Alaska, USA · production well
Before
94
After
413
barrels of oil per day
Reported production response; read the original curve and treatment context.
Read this case studyOman · horizontal production well
Before
12
After
39
m³ of oil per day
Reported peak on a horizontal well; the original curve shows a later decline.
Read this case studySavings & downtime
Start with daily oil production, compare total downtime, then add the actual quotes for each treatment. Explore the assumptions in our USD calculator.
Compare your well in USDPotential savings
$9,870 USD
from a shorter shutdown with Resonflux
36 fewer hours offline in this example: 12 hours with Resonflux vs 48 hours for acidizing.
Illustrative example · not a quote
94 barrels/day × $70/barrel × 36 hours ÷ 24. Only the production baseline comes from the Prudhoe Bay case; price and downtime are editable assumptions.
This is the reduction in gross production value deferred, not guaranteed cash savings or profit. Treatment fees are excluded; deferred production may be recovered later.
Share with your team
A four-page overview of the treatment, two documented wells and an illustrative savings scenario.
This service targets restricted flow in the rock around the producing or injection interval. Mechanical tubing cleanout, removing large debris and repairing a pump are separate jobs.
It depends on access and the completion. Selected gas-lift wells have been treated through coiled tubing while producing. Other wells require downtime; we include deployment and restart in the assessment.
The documented active-treatment range is typically 4–8 hours per near-well zone. Total job time also includes setup, deployment and recovery. Horizontal sections and multiple zones can take longer.
Start with the well location, current production or injection rate, the problem you are seeing, and any completion information. Partial data is fine. We can identify what else is needed.
We will review the available data, discuss whether the technology fits and explain the next steps.