Documented technology case
Marmul MM-595: what the record shows
The supplied technical record reports an increase from 12 to 39 m³ of oil per day on a horizontal well. The source curve also shows a subsequent decline, so 39 m³/day should not be treated as a sustained production forecast.
Oman · Horizontal oil-production well
Reported pre-treatment rate
12
m³ of oil / day
Reported post-treatment peak
39
m³ of oil / day
Selected before/after comparison
+225%
Reported response, not a guarantee for another well.
Production before treatment
The English presentation identifies MM-595 as a horizontal well at Marmul and gives a pre-treatment oil rate of 12 m³/day. The supplied summary does not establish the precise damage mechanism or provide the full completion and operating history.
Reported response
The presentation reports 39 m³/day after treatment, compared with 12 m³/day beforehand. That is an increase of 27 m³/day, or 225%, for the selected comparison. In the accompanying curve, 39 m³/day is a post-treatment high point and later points are lower.
How the treatment is described
The well is presented as an example of vibro-resonance bottomhole-zone treatment. The method places a generator at the selected interval and circulates fluid through it. For horizontal wells, the overview says treatment duration depends on the horizontal interval length; it does not give a verified total shutdown period for MM-595.
Watch the step-by-step explanationWhy this matters for your assessment
The calculator can use the documented 12 m³/day baseline, approximately 75.48 barrels/day. Its default price and downtime are separate illustrative assumptions. Assess the actual interval length and job scope before estimating your own costs.
Compare your well in USDRead the original production curves
Read the complete source curve, not just its highest point. It shows variation before treatment, a post-treatment increase and a later decline. The supplied record does not establish how much of that change was due to treatment versus changes in operating conditions.
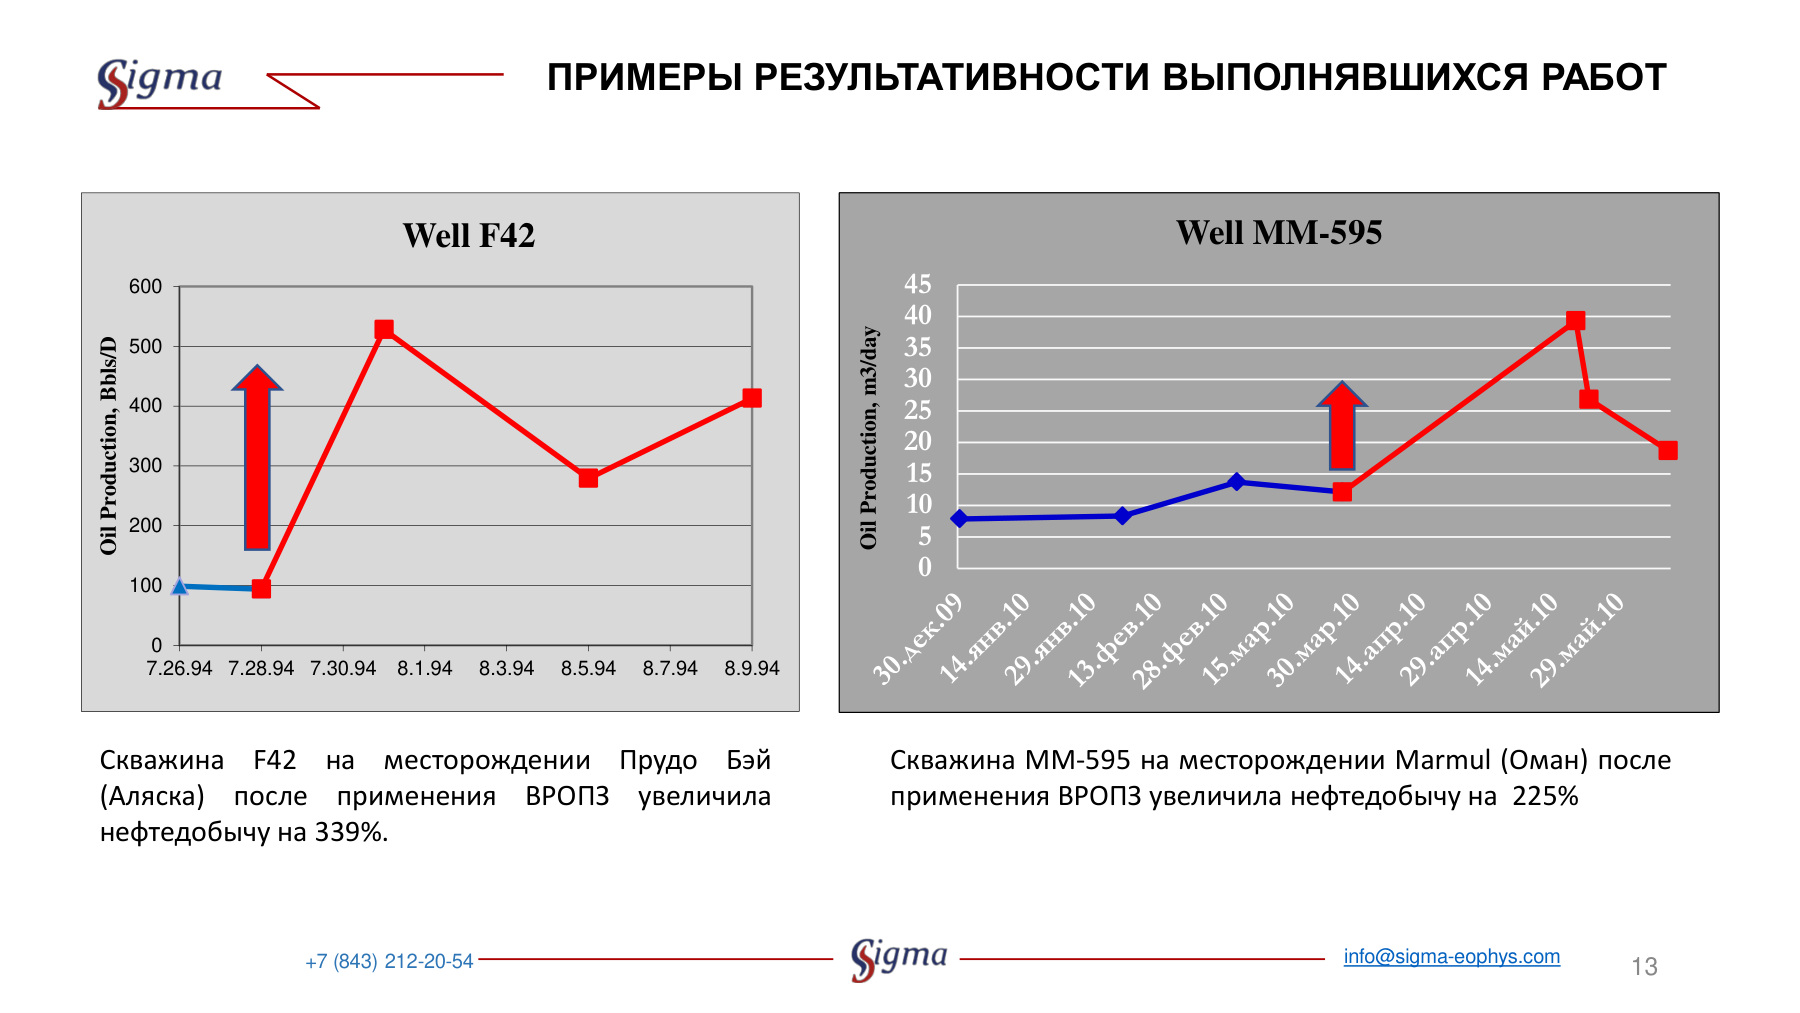
Numeric summary: supplied English technical presentation, slide 8 (PPTX). Treatment context: Russian overview, page 7.
This is a historical technology example from supplied materials, not a new Resonflux field trial, an independent operator audit or an endorsement by the field operator.
What these documents cannot establish
- The reported peak does not establish a sustained 39 m³/day production rate.
- The full daily history, comparable operating conditions and measurement uncertainty are not supplied.
- No matched alternative-treatment cost, exact total downtime or validated payback period is supplied.
Could your well be a candidate?
Start with the production history, completion details and the problem you want to address. We can identify what else is needed.