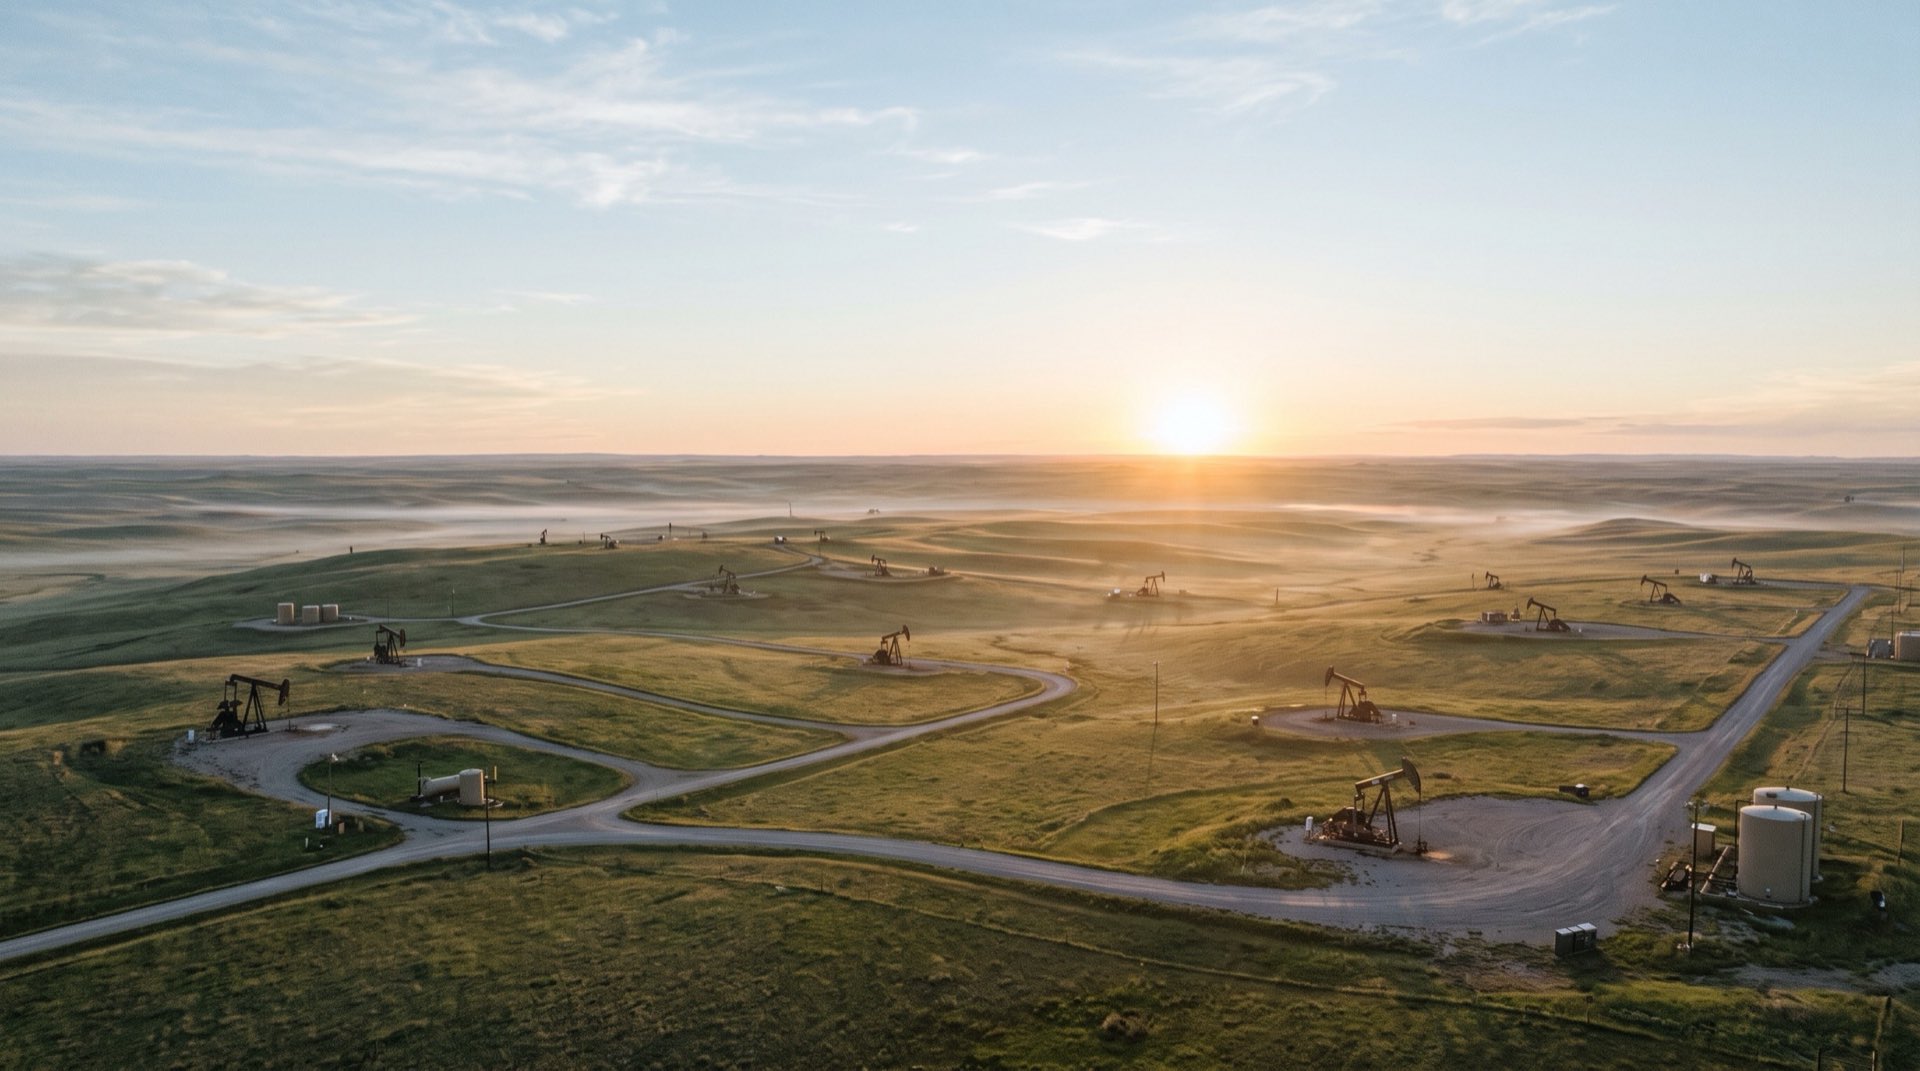
USA (Alaska)
Prudhoe Bay · Well F-42
Before
94 BOPD
After
413 BOPD
+339%
Gas-lift well treated via coiled tubing without shutting the well down.
Field results
The supplied technology record includes roughly 600 production and 400 injection wells and a reported 65–70% success rate. Explore the measured examples and original records. Individual results do not predict the response of your well.
Average injectivity increase on injection wells
Documented success rate across all treatments
Countries: Russia, USA, China, Oman, India, Norway, Azerbaijan
Years of continuous field implementation
Selected treatments across production, injection and horizontal wells.
USA (Alaska)
Before
94 BOPD
After
413 BOPD
Gas-lift well treated via coiled tubing without shutting the well down.
Oman
Before
12 m³/d
After
39 m³/d
Horizontal well; treatment duration scaled to the horizontal section length.
Russia
Before
37 m³/d
After
137 m³/d
Injection well: intake rate almost quadrupled after resonance cleaning.
Russia
Before
239 m³/d
After
668 m³/d
One of the world’s largest oilfields: injection response after treatment.
Azerbaijan
Before
20-day MTBF
After
60-day MTBF
2021: production doubled; maintenance-free period tripled (20 → 60 days).
Russia (West Siberia)
Before
Baseline profile
After
Thicker interval
Production-profile log shows a thicker contributing perforation interval after stimulation and a matching rise in oil production.
Russia
Before
~430 m³/d
After
~710 m³/d
Long-duration stimulation using the well’s existing injection pressure.
These simplified curves show the documented rates before and after treatment. The shape illustrates the comparison; it is not a full daily production history or a guaranteed response profile.
Stylised response curve: rates and dates as documented in field records. Gas-lift well, treated via coiled tubing while producing.
Stylised response curve: documented rates. Horizontal well; treatment duration scaled to the horizontal section.
Production wells show oil-rate increase; injection wells show intake increase. Sources: field documentation, 1986–2021.
Cleaner wells, longer uptime, permanent stimulation: effects measured in the field, not projected.
Absheronneft · Azerbaijan · 2021
Well 1024 doubled its oil production after treatment, while its maintenance-free period tripled (20 → 60 days). On neighbouring well 1025, production rose 30% and the maintenance-free period stretched from 22 to 108 days, 4.9× longer.
White Face field · Texas, USA
During vibro-resonance treatment of an injection well, the solid-particle content (iron sulfate) in the lifted fluid fell six-fold, providing direct, measurable evidence of the near-well zone being cleaned.
Tajmurzino · Well 1536 · Russia
A generator was permanently installed downhole and ran continuously for about 1.5 months, holding injectivity roughly 40% higher for the entire period, using only the well’s existing injection pressure.
Samotlor · Well 4933 · Russia
The productivity index rose from 3.8 to 10.4 t/day/atm (+173%), 4% above the value the well had when it first entered operation. Resonance cleaning didn’t just recover the well; it beat its original state.
On documented Tatneft and Nizhnevartovskneftegaz wells, core permeability rose 2–3× after treatment (0.33 → 0.77 D; 0.114 → 0.363 D), with oil rates up 33–43% and injectivity up 18–47%.
These aren’t surface estimates; they’re downhole measurements of the physical change in the near-well zone: permeability, piezo-conductivity and dynamic level all shift together.
30-year averages, ~1,000 wells
Average sustained increase after treatment
Average intake increase after treatment
Across all treatments, onshore and offshore
Every figure on this page traces back to a document: well logs, productivity-index diagrams and photographs taken during the treatments themselves.
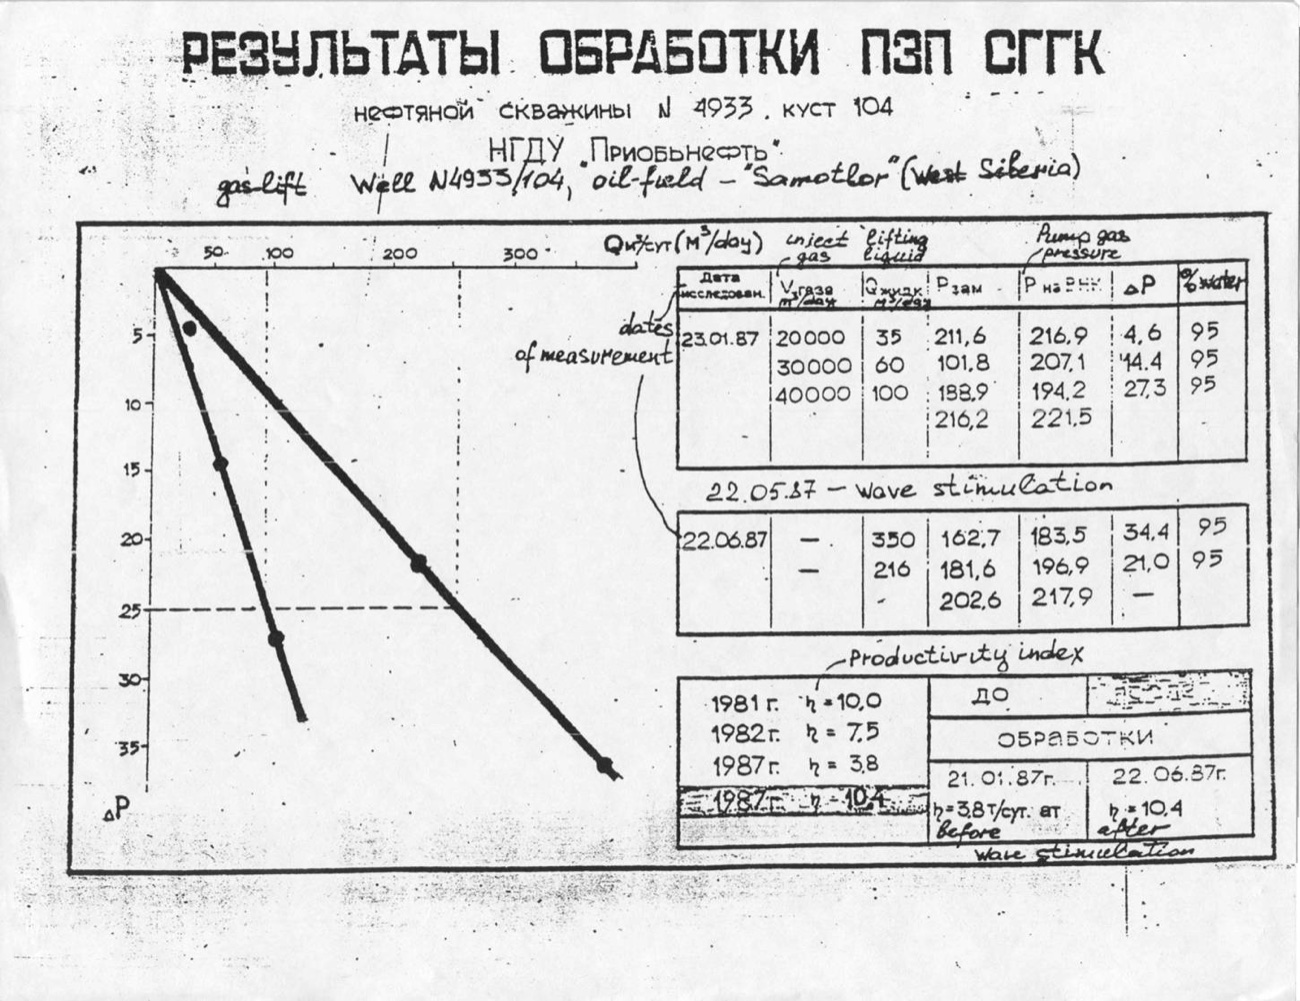
Well 4933 · Samotlor: productivity index
The record traces the well’s decline year by year: 10.0 in 1981, 7.5 in 1982, down to 3.8 by 1987, then 10.4 after wave stimulation, above the value it had when first completed.
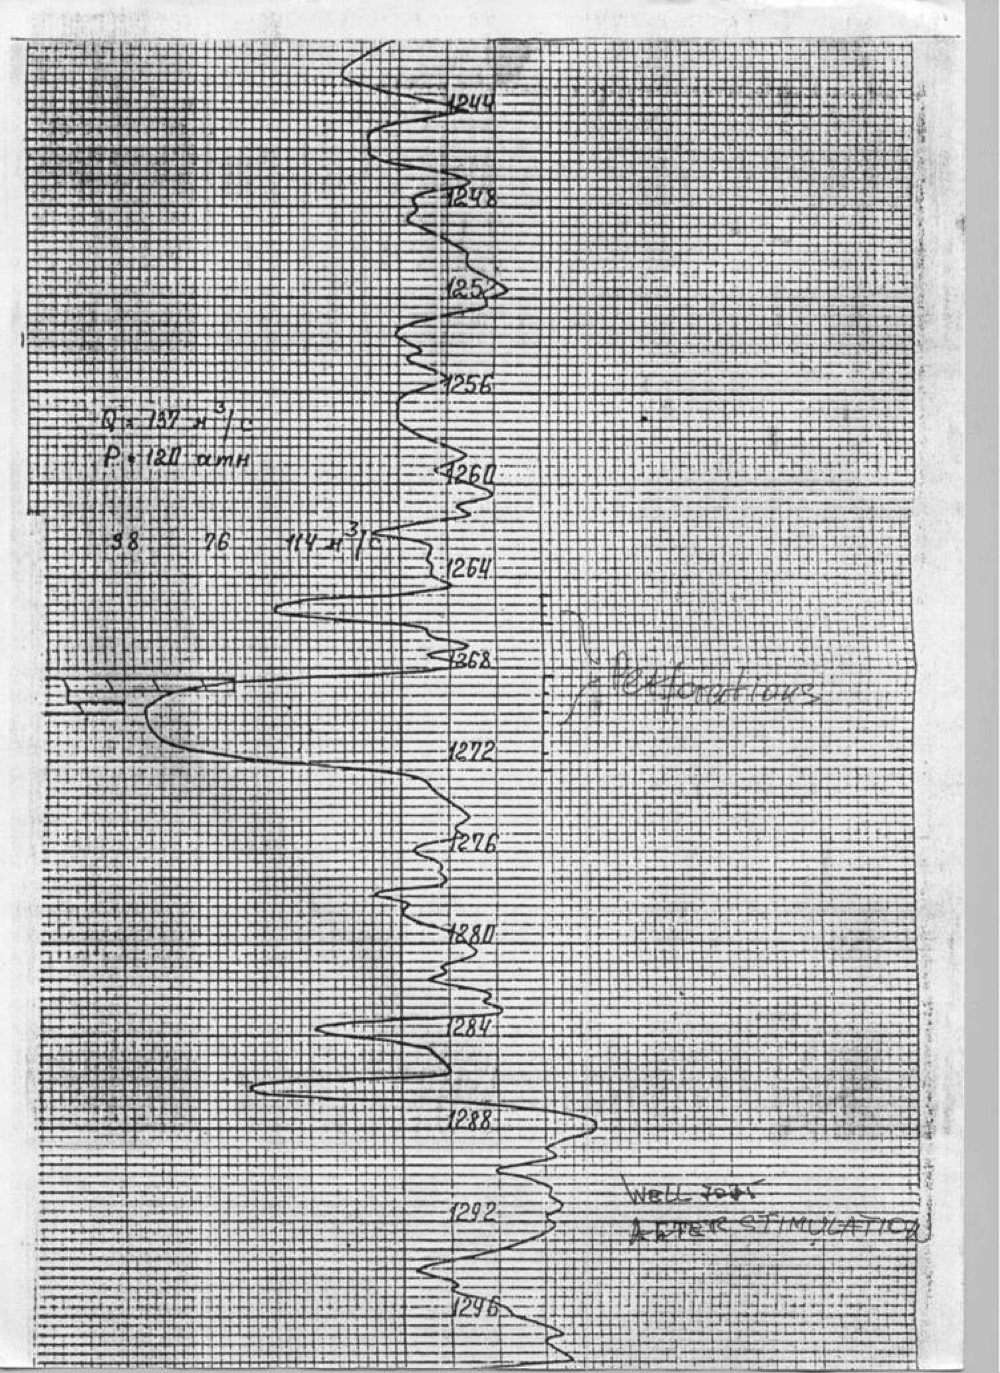
Spinner log after treatment
The flowmeter survey shows the contributing perforation interval grown thicker after stimulation, with previously silent layers rejoining the flow.
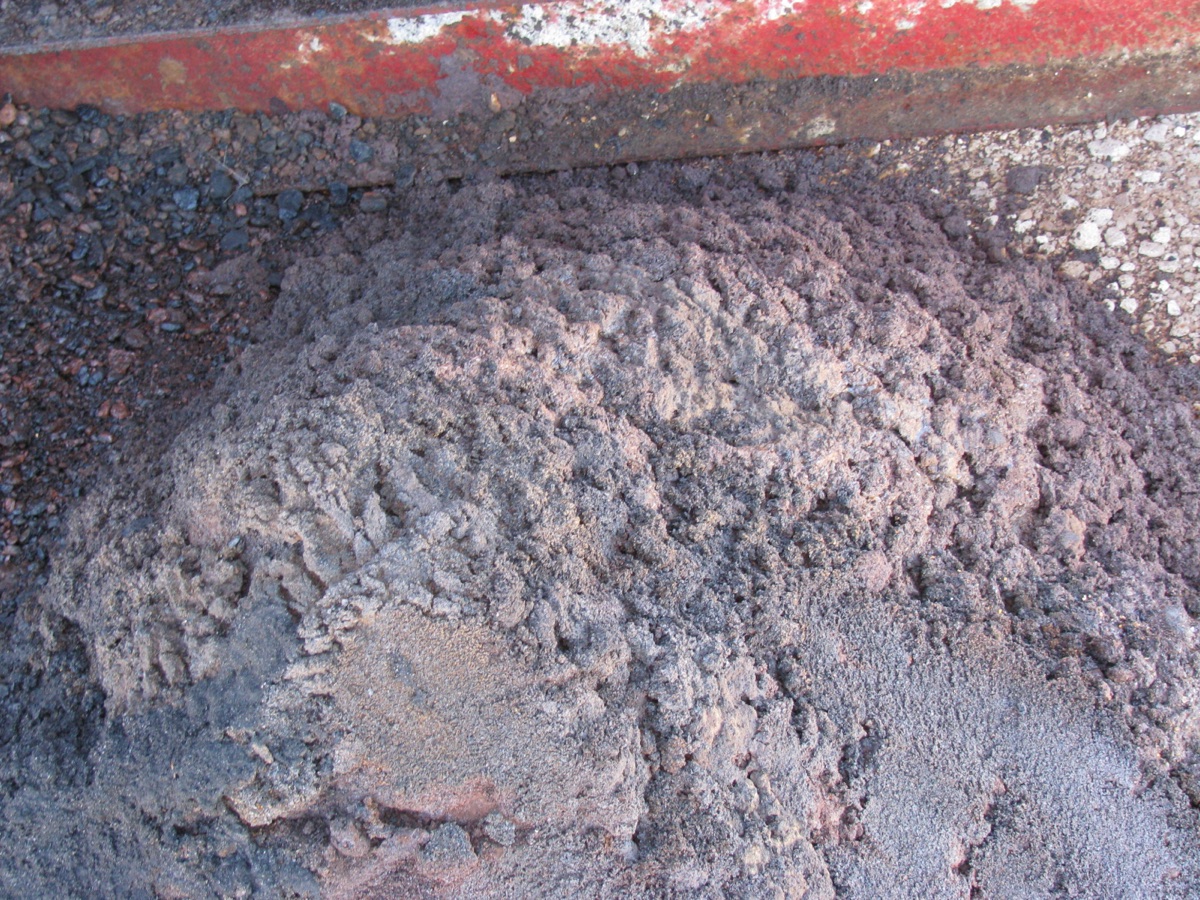
What comes out: West Texas
Iron sulfate solids lifted out of an injection well during vibro-resonance treatment. Solid-particle content in the lifted fluid fell six-fold as the blockage was physically removed.
Savings & downtime
Start with daily oil production, compare total downtime, then add the actual quotes for each treatment. Explore the assumptions in our USD calculator.
Compare your well in USDPotential savings
$9,870 USD
from a shorter shutdown with Resonflux
36 fewer hours offline in this example: 12 hours with Resonflux vs 48 hours for acidizing.
Illustrative example · not a quote
94 barrels/day × $70/barrel × 36 hours ÷ 24. Only the production baseline comes from the Prudhoe Bay case; price and downtime are editable assumptions.
This is the reduction in gross production value deferred, not guaranteed cash savings or profit. Treatment fees are excluded; deferred production may be recovered later.
Environmental aspects
The documented procedure uses fresh water without added acid or chemical cleaning reagents. Fluid compatibility and handling of returns remain part of the well-specific operating plan.
The circulation procedure uses standard oilfield equipment and a qualified crew. The treatment plan must address well integrity, pressure limits, fluid compatibility and handling of returns.