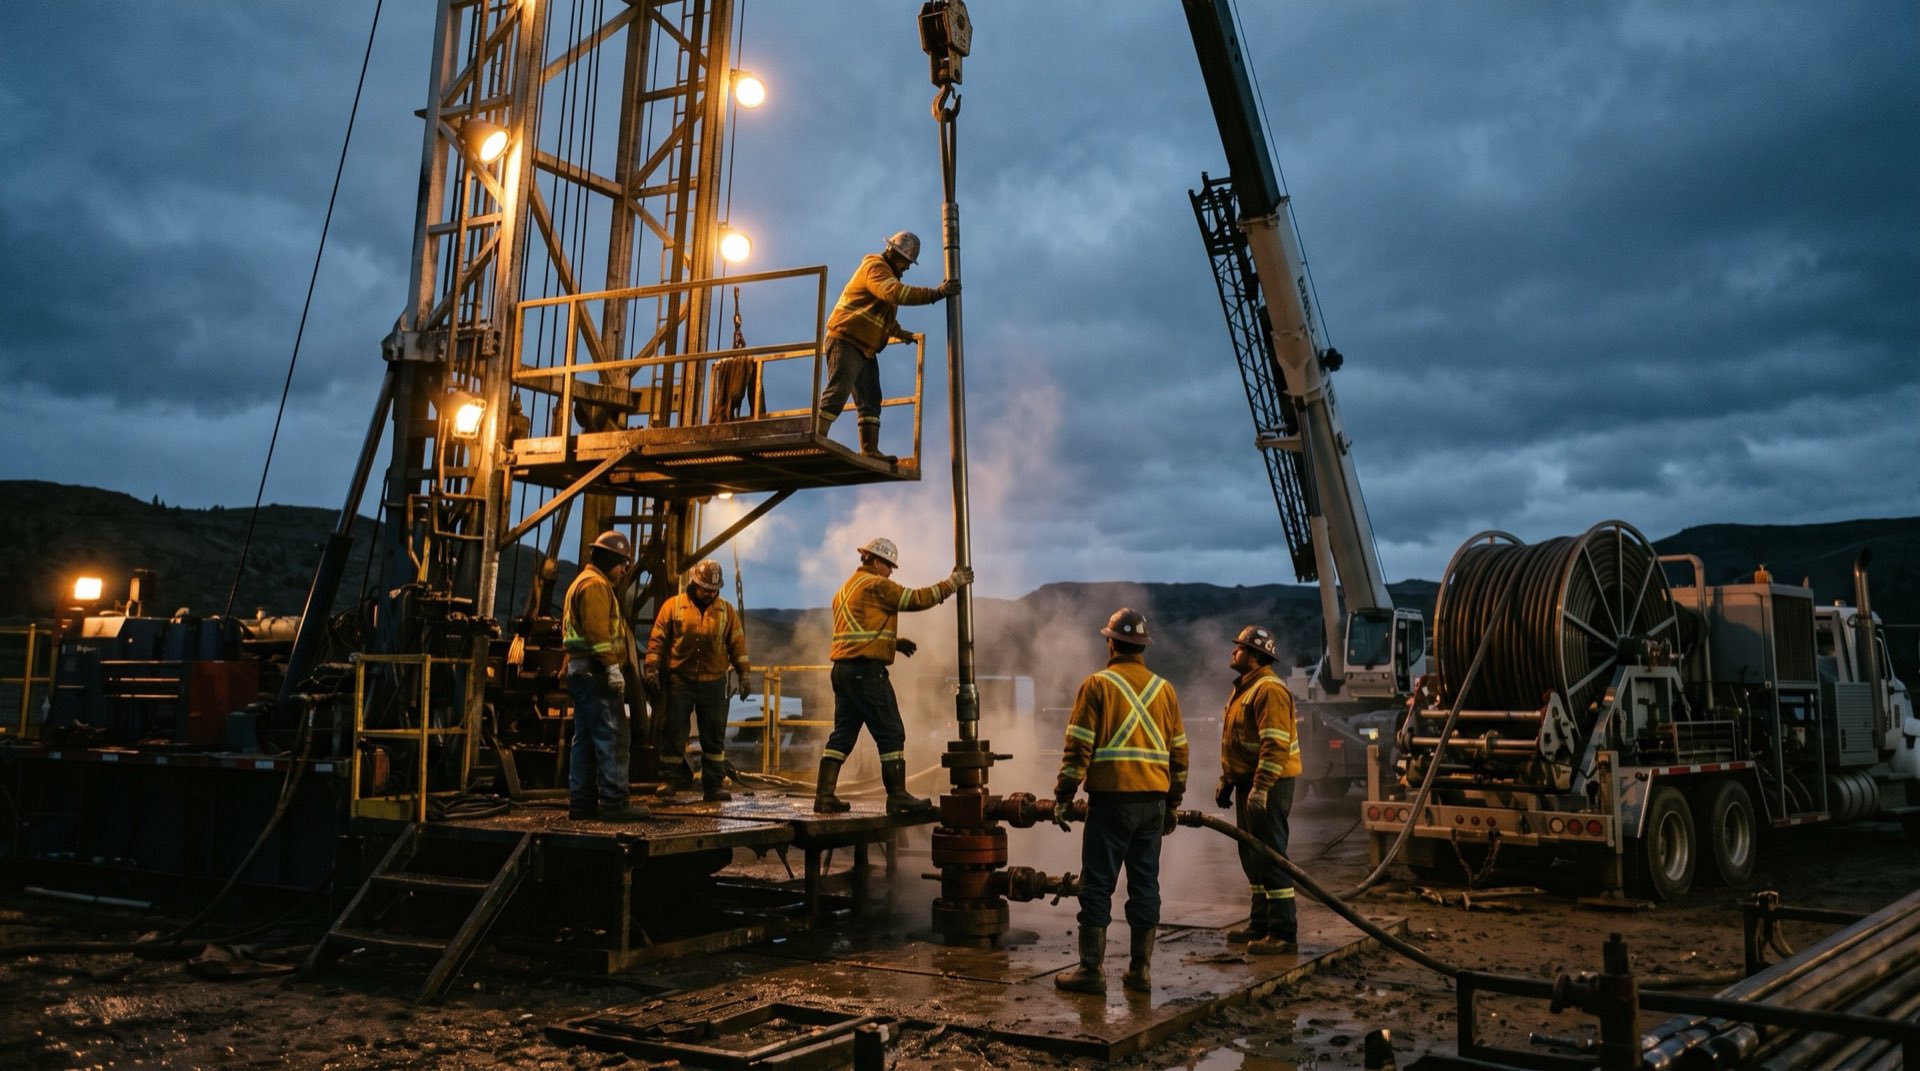
Before treatment 01
Oil flow becomes restricted
Oil moves through tiny spaces in the rock toward the well. Deposits and trapped fluids can make those paths harder to pass through.
How it works
The bottomhole zone is the rock around the well’s producing interval. We position a tool inside the well and circulate water through it to generate vibrations that help loosen restrictions in that rock.
Oil moves through tiny spaces in the rock toward the well. Deposits and trapped fluids can make those paths harder to pass through.
Water flows through the Wave Generator downhole. The resulting pressure waves help loosen and mobilise material in the target zone.
If the restriction responds, oil can flow more easily into the well. We measure the response against the well’s previous performance.
Grey circles represent rock grains; lines show flow paths; the vertical channel is the well. Simplified illustration, not to scale. We treat the rock around the well’s producing interval — the bottomhole zone. Suitability and results depend on the well.
Review the production history and locate the interval where flow is restricted
Use formation data to design the Wave Generator and plan the circulation
Attach the wave generator to the end of standard production tubing or coiled tubing
Lower the tubing so the generator sits exactly at the target stimulation interval
Circulate at the planned rate and pressure, then measure the production or injection response
A surface pump sends water down the tubing through the generator. Returning fluid travels up the space around the tubing to a separation tank. Active treatment typically takes 4–8 hours per zone; deployment and restart add to the schedule.
With coiled tubing, the generator is lowered inside the tubing to the perforation zone, so gas-lift wells can be treated while producing. Used at Prudhoe Bay (Alaska) and on a North Sea platform.
This is the technical process behind our oil well cleaning services. The treatment focuses on restricted flow through the rock around the wellbore, with the target interval selected from well data.
Two physical mechanisms (confirmed by calculation and laboratory experiment) explain how acoustic energy in resonance mode releases oil that pressure alone cannot.
Mechanism 1
The passing sound wave physically tears oil droplets off the rock grains because the acoustic force exceeds the adhesion between the droplet and the pore channel.
Mechanism 2
Larger droplets become mobile and merge into continuous oil “channels”. The acoustic force, together with Van der Waals attraction, overcomes electrostatic repulsion holding oil films on the grains.
Even small pressure-wave amplitudes measurably increase the mobility of formation oil.
Distance at which the generated sound waves were reliably detected from the device.
Increase in filtration speed in a saturated porous medium under resonance-mode vibration.
A well can produce more total liquid without producing more oil. We review the target interval and oil, gas and water rates to distinguish an improved oil response from increased water flow.
Vibro-resonance stimulation is designed to target the damaged interval using a frequency selected for its formation properties.
An important screening indicator is a positive skin factor on the target interval. It indicates extra resistance to flow; it does not, by itself, guarantee a successful treatment.
Chemical-free alternative to acidizing: the comparison →The source of vibration
The generator is a housing with tangential inlet channels, a vortex chamber and a diffuser. Its geometry (together with the hydrodynamic parameters of the pumped fluid) defines the frequency and amplitude it produces.
Resonance happens when the generated frequency matches the natural frequency of the treated near-well zone, estimated from the formation’s porosity and permeability through its filtration “noise”.
Every generator is custom-built for its well, to hit that formation’s band. Typical working range: 1.5–10 kHz.
Generator with an additional diffuser
Diffuser shaped as a body of revolution
Resonance chamber of variable volume
Two inlet channels and two outlet diffusers
Spring-loaded annular protrusion: high amplitude at low frequencies
Resonance is a band, not a point. Each generator is tuned to its formation
Illustrative curve: the 1.5–10 kHz band and 2–3× filtration gain are documented; each generator is engineered to its formation’s resonant frequency.
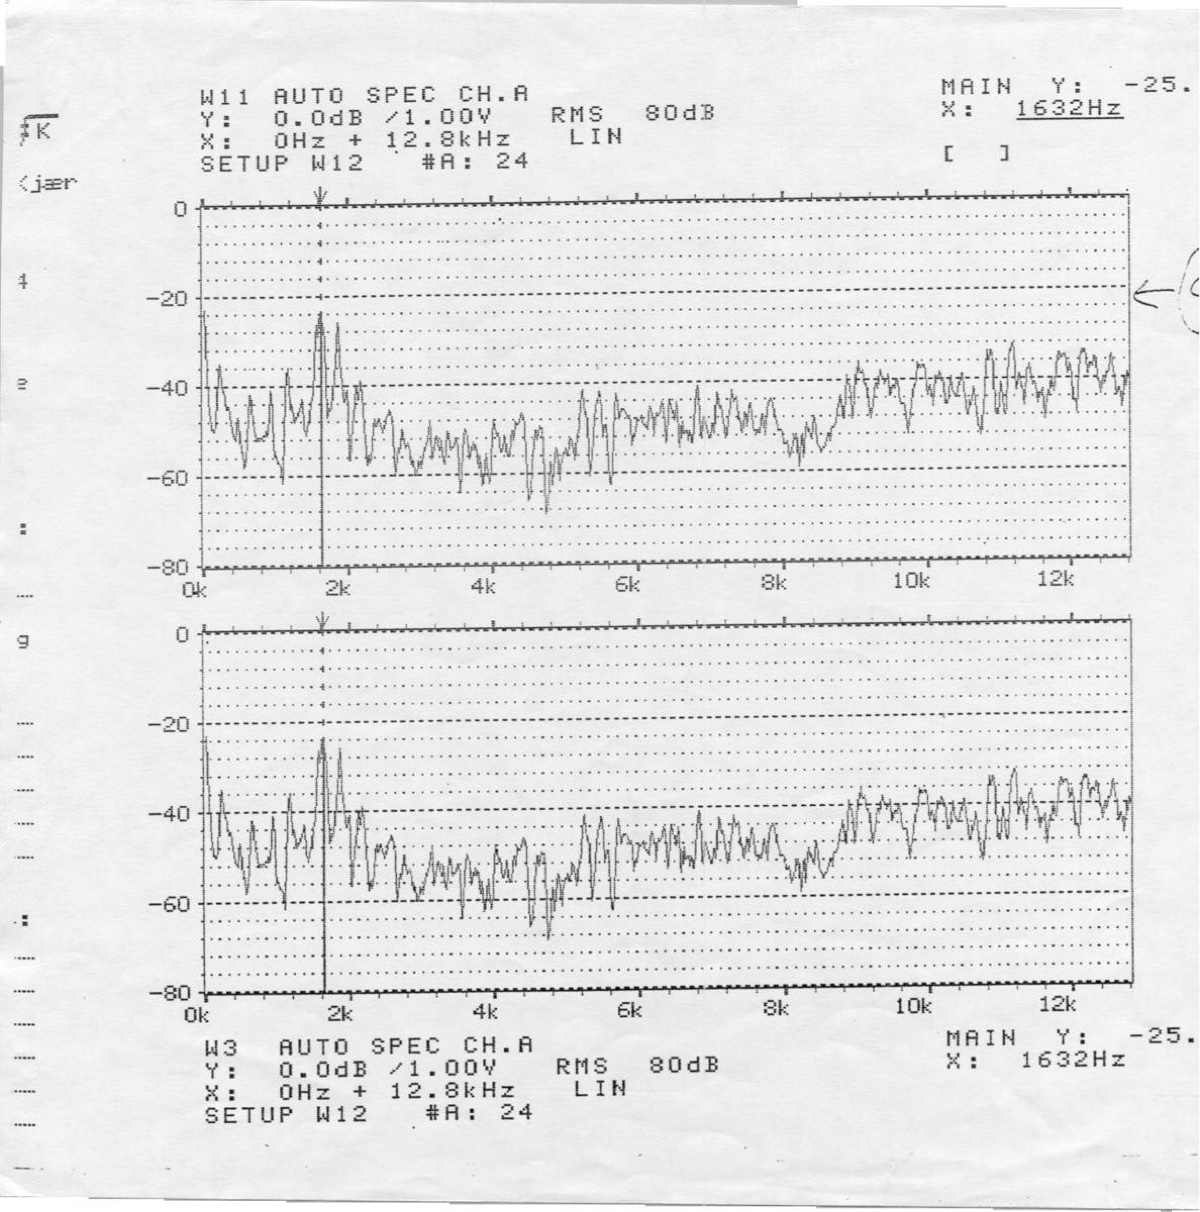
1,632 Hz Spectrum analyser trace from the experimental stand showing the generator's dominant peak, recorded on two channels. This is how every generator is characterised before it is matched to a formation's resonant band.
The generators were characterised on an experimental stand simulating real downhole conditions: a 5-metre section of 178 mm casing under 5–10 MPa static pressure, fed by a 14.5 MPa line.
Side-mounted sensors recorded each generator’s amplitude–frequency response, while a core holder measured how vibration changes filtration rates through actual core samples.
The result: a validated design method that links formation data to generator geometry, before anything is lowered into your well.